
Every month the UK Civil Aviation Authority releases its monthly statistics on UK airports and routes.
Every month I will break down the monthly statistics of Aberdeen, Edinburgh, Glasgow and Prestwick airports to try and provide some context to the information published.
At the end of every post I will also take a more detailed look at a country served from Scotland to try and understand any changes in travel patterns across the UK, as sometimes a basic year-on-year comparison does not go far enough.
The table below can be used to jump to a specific section if you would rather just read that part rather than the whole post.
- Scotland’s Main Airports Comparison
- Market Share Within Scotland
- Market Share Within the UK
- Country In Focus – Hungary
Scotland’s Main Airports Comparison
| Airport | 2024 | 2023 | % Change |
|---|---|---|---|
| ABZ | 175,310 | 172,545 | 1.6% |
| EDI | 1,090,264 | 990,227 | 10.1% |
| GLA | 558,251 | 505,896 | 10.3% |
| PIK | 24,649 | 20,664 | 19.3% |
All four of Scotland’s main airports recorded an increase in passenger numbers compared to November last year, with both Edinburgh and Prestwick recording monthly totals above 2019 levels.

It should be remembered that 2020 and 2021 were impacted by the pandemic.
Market Share Within Scotland
In the November 2024 Statistics, 16 airports in Scotland reported passenger numbers to the Civil Aviation Authority.
Between them these airports handled 1,950,590 passengers. Below is a breakdown of the percentage of the market each of these airports had in November 2024.
| Airport | 2024 | 2023 | % Change on 2023 |
|---|---|---|---|
| Aberdeen | 8.99% | 9.63% | -0.64% |
| Barra | 0.03% | 0.03% | 0% |
| Benbecula | 0.10% | 0.13% | -0.03% |
| Campbeltown | 0.02% | 0.03% | -0.01% |
| Dundee | 0.12% | 0.17% | -0.05% |
| Edinburgh | 55.89% | 55.25% | +0.65% |
| Glasgow | 28.62% | 28.22% | +0.39% |
| Inverness | 2.62% | 2.79% | -0.16% |
| Islay | 0.10% | 0.11% | -0.01% |
| Kirkwall | 0.56% | 0.62% | -0.06% |
| Lerwick | 0.01% | 0.01% | 0% |
| Prestwick | 1.26% | 1.15% | +0.11% |
| Stornoway | 0.43% | 0.51% | -0.08% |
| Sumburgh | 1.06% | 1.14% | -0.07% |
| Tiree | 0.03% | 0.04% | -0.01% |
| Wick | 0.03% | 0.06% | -0.06% |
The percentages in the table above may not add up to exactly 100% due to rounding!
Overall a very mixed performance across the country, however, some airports such as Barra and Campbeltown only have one route and are therefore susceptible to passenger number losses compared to the main airports in the country.
Market Share Within the UK
When taking a holistic view of Scotland’s main airports performance across the UK, comparing their market share today with their market share pre-covid offers a valuable insight into their recovery.
As a group Aberdeen, Edinburgh, Glasgow and Prestwick have recovered their total share of the UK market when compared to 2019, with both years having 9.1%. This offers an ideal month for a comparison.
The two AGS owned airports have reduced market share compared to pre-pandemic with Aberdeen not only having a reduced market share, but also a reduction compared to last year.
Prestwick has recorded a slight increase and is roughly where it was before Covid. Edinburgh appears to have had the strongest recovery off the four airports, despite having the 3rd lowest growth of the four in November.
Country In Focus – Hungary
Every month I will take a country and perform a more detailed analysis of its performance from Scotland. For this month I have selected Hungary as it has been a year since WIZZ Air moved its Budapest service from Edinburgh to Glasgow.
Two airlines serve Hungary from Scotland, with both operating flights to Budapest;
- Ryanair from Edinburgh on the Boeing 737-800/Boeing 737-8-200
- WIZZ from Glasgow on the Airbus A321NEO
Passenger numbers from 2015 are included in the table below,
| Year | Edinburgh | Glasgow |
|---|---|---|
| 2015 | 2,531 | 2,510 |
| 2016 | 2,651 | 2,770 |
| 2017 | 5,438 | 2,578 |
| 2018 | 6,288 | 2,993 |
| 2019 | 13,125 | 3,018 |
| 2020 | 615 | 0 |
| 2021 | 5,591 | 0 |
| 2022 | 12,309 | 0 |
| 2023 | 7,805 | 1,975 |
| 2024 | 7,963 | 3,457 |
The above data is shown in graph form below for a better visual representation.

For the next set of information I will be referencing the table of data below which looks at every UK airport that has had service to Hungary since 2015.

Before I continue, three points I should make are;
- DSA is now closed, with WIZZ moving routes to LBA
- LTN also includes a route to Debrecen alongside Budapest
- The UK-Hungary market is smaller than it was in 2019
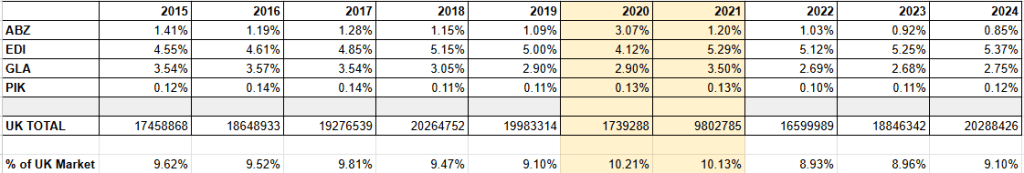
Using the monthly total for passengers between the UK and Hungary the monthly market share for each airport is included in the table below;

Looking across the UK, based on November 2024 data there were 13 airports with service to Hungary, down from 15 in 2019 (DSA is one of these 15!).
Doing a comparison with 2019, outside of the airports who have lost their service, London Gatwick has seen the biggest fall in market share, reducing by 4.6%, Luton and Stansted also recorded reductions of 1.77% and 1.01% respectively, with Heathrow being the only London airport to increase its share.
Elsewhere in the country, market share increased, with Manchester, Liverpool, Leeds and Newcastle all seeing their market share improving.
Scotland presents an interesting contrast in market share performance, with Edinburgh’s share falling, and Glasgow’s increasing.
Glasgow has not only recovered to 2019 levels, but has increased beyond it by 0.47%, contrasted with a 1.82% reduction in Edinburgh, partly fuelled by the WIZZ Air switch to Glasgow.
Enjoying My Content?
If you are enjoying my content and would like to support me then I have included a donation link below, you can also share this post on social media!

About The Author

George Nugent is an independent travel writer focused on honest reviews of rail, air, and coach journeys in the UK, Europe, and USA. Passionate about statistics and clear reporting, George shares insights to help travellers make informed choices.
